DATA VISUALIZATION
ETP-WTP Financial Ecosystem Visualization Grundfos SafeWater
Overview
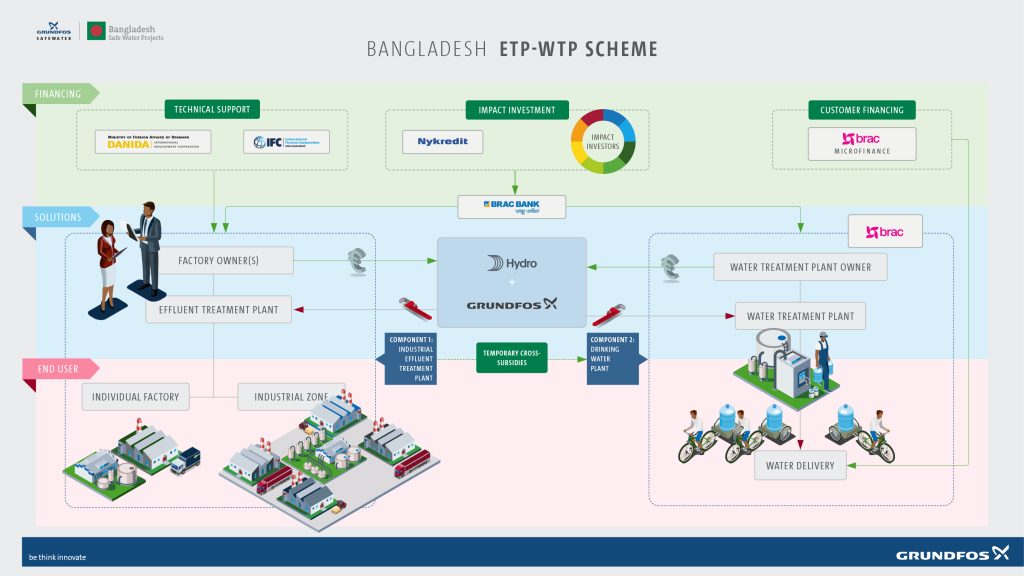
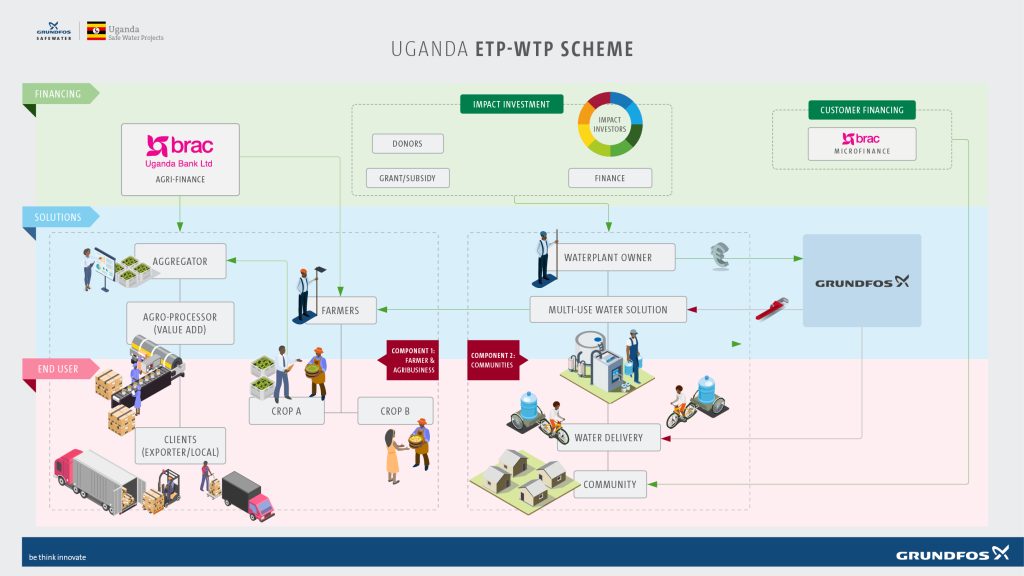
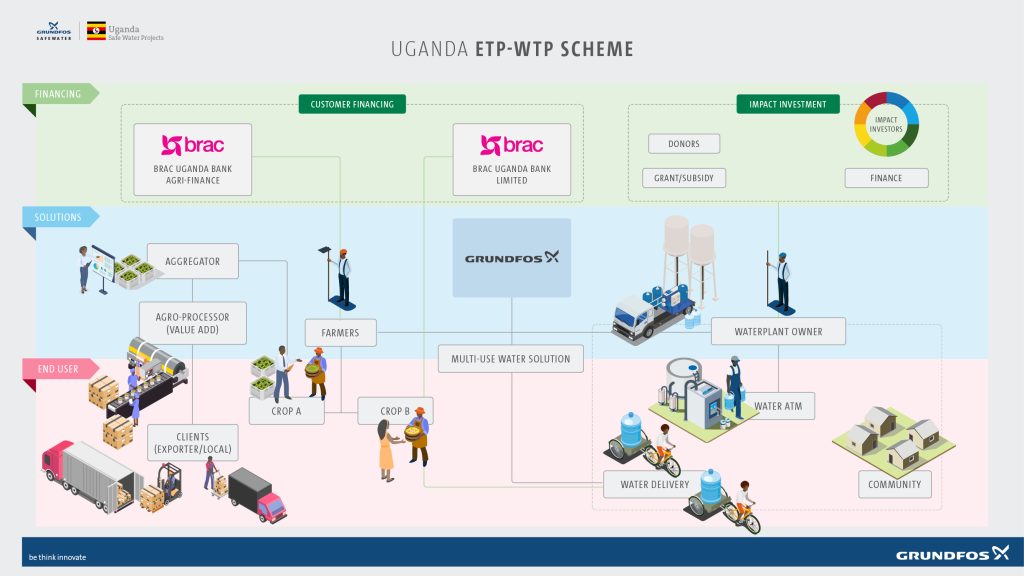
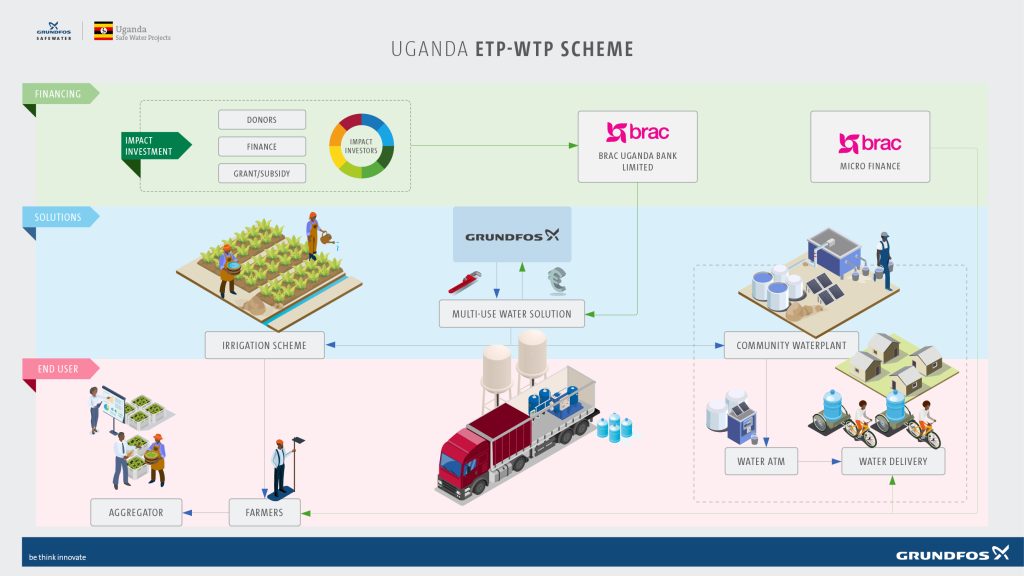
For Grundfos SafeWater, the challenge wasn’t just technical, it was systemic. This project involved the creation of a comprehensive visual framework to explain the Effluent Treatment Plant (ETP) and Water Treatment Plant (WTP) schemes in Uganda and Bangladesh. Letter Case designed a series of high-level ecosystem maps that visualize the flow of financing, technical solutions, and end-user impact to help stakeholders understand how cross-subsidies turn industrial waste into community resources.
Design Concept
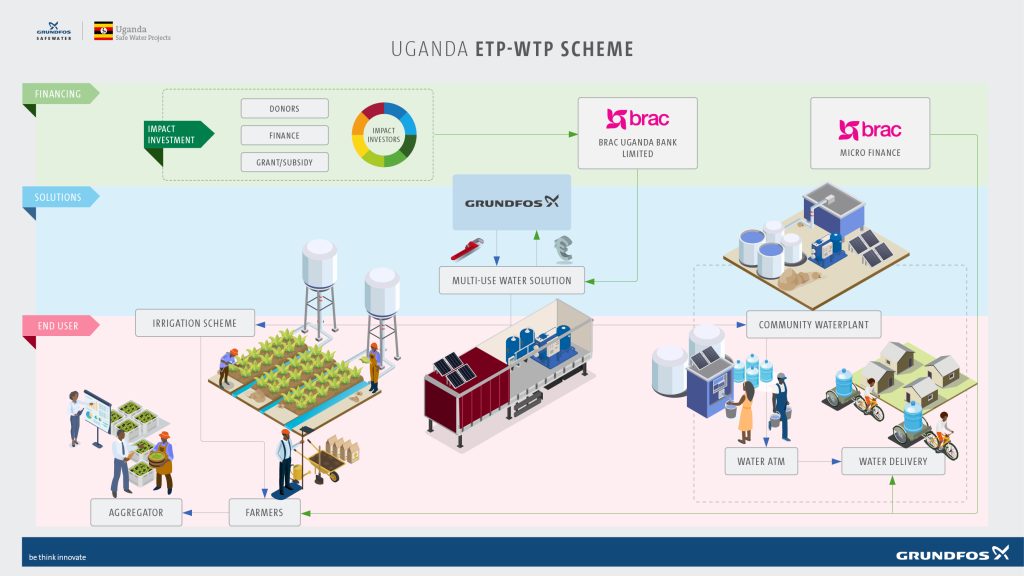
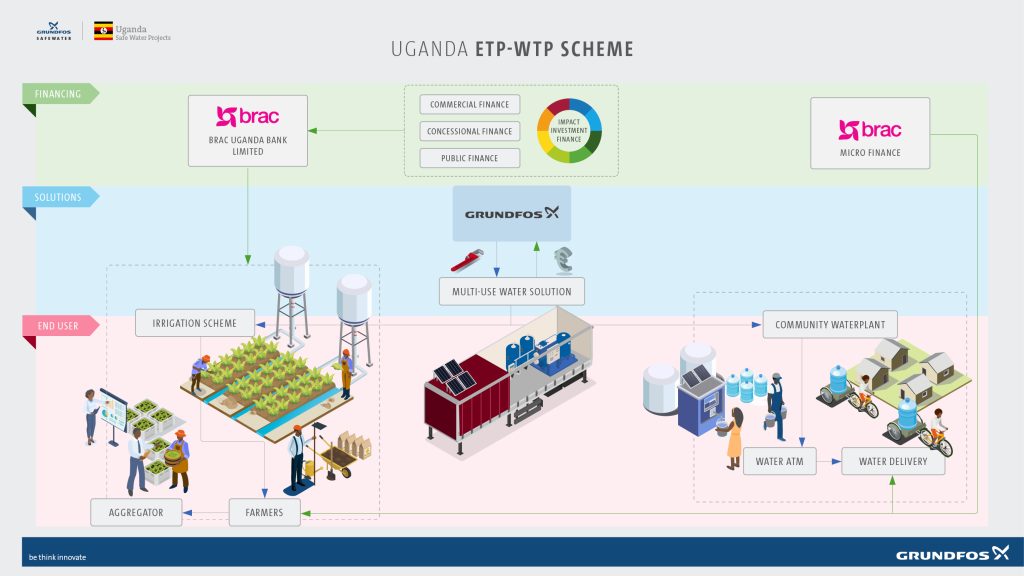
The visual strategy was built on “Layered Complexity.” We divided the ecosystem into three horizontal tiers; Financing, Solutions, and End Users, to create a consistent “gravity” for the information. By using a clean, isometric illustration style, we transformed abstract financial concepts into a tangible journey from investors to individual farmers and families.
Key Features:
- Multidimensional Stakeholder Mapping: We visualized the interplay between global entities (IFC, DANIDA), local financial institutions (BRAC Bank), and on-the-ground operators. This allows viewers to trace how a single investment dollar moves through technical support and into infrastructure.
- Custom Isometric Assets: To maintain brand consistency and clarity, we developed a library of custom isometric icons representing factories, water ATMs, mobile delivery units, and agricultural schemes. This makes the regional differences between the Bangladesh and Uganda models immediately apparent.
- Process Transparency: Through the use of “Temporary Cross-Subsidies” logic flows, the design explains how revenue from industrial effluent treatment directly funds clean drinking water for domestic use, making a complex circular economy model easy to grasp.
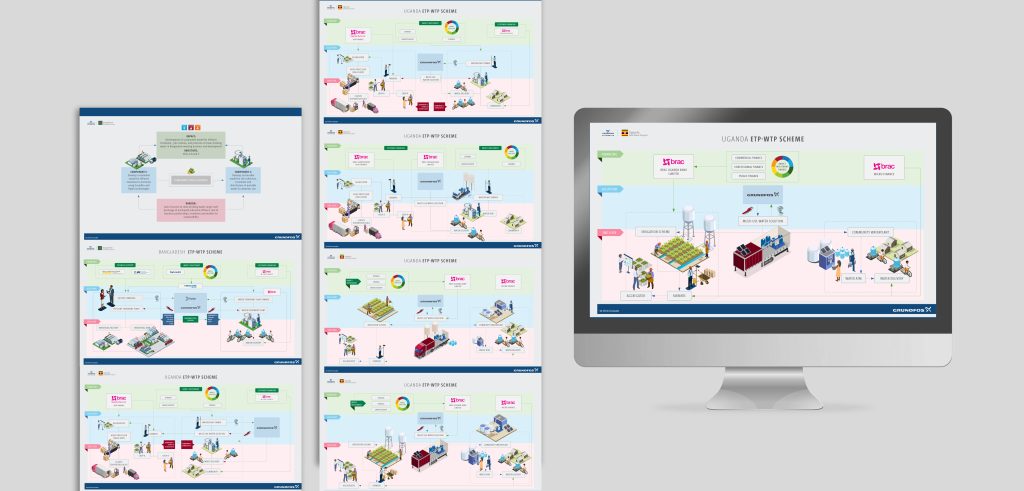
- Regional Variation Design: The Uganda and Bangladesh schemes were designed as sister layouts. While they share a common visual DNA, the specific “Solutions” layer was customized to reflect local realities, such as “Agro-Processor” value chains in Uganda versus “Industrial Zone” impacts in Bangladesh.
- Information Hierarchy: Despite the high density of information, we utilized a muted color palette for the background layers and vibrant accents for the primary “Impact” points, ensuring the viewer’s eye is always drawn to the end-user benefit.
The Outcome
The resulting visualizations have become a cornerstone for Grundfos SafeWater’s regional proposals. By turning dense financial spreadsheets into an intuitive “Economic Map,” we enabled Grundfos to communicate their value proposition to non-technical donors and government officials with speed and clarity.
Role: Information Design / Ecosystem Mapping / Isometric Illustration
Client: Grundfos SafeWater
Focus: Sustainable Finance & Infrastructure
Design Insight:
The goal was to make the ‘invisible’ visible. By showing the financial plumbing alongside the actual water plumbing, we helped stakeholders see SafeWater not just as a pump provider, but as a system architect.